Dive Travels
The APOCALIPTRIP: CCR Research Expedition in the Red Sea
It all started in the spring of 2019, when a team from JJ-CCR, the makers of the “JJ” closed circuit rebreather, and Red Sea Explorers got together to find new wrecks in the Red Sea and dive some of rarely frequented wrecks in the area, particularly in the Gulf of Suez.
The plan was to make two dives a day to normoxic trimix depths during the six-day expedition. The organizers contacted DAN Europe to see if they would be interested in studying the decompression protocols and results of a group of experienced closed-circuit rebreather divers using different decompression strategies.
DAN agreed to supply an physician, and provide an experimental setup to analyze divers’ potential increased risk using Echocardiography to count divers’ vascular gas emboli (VGE) post-dives. DAN was not recommending any specific diving procedures. It was there only to monitor the divers’ physiological status and bubble dynamics following their dives.
Unfortunately, in that first expedition, it was difficult to obtain enough data for a full scientific study. As a result, it was decided to run a longer study, which would include more divers and additional measurements to generate sufficient data to complete a study. I agreed to help in my capacity as DAN Europe's Director of Research. That was perfect for the teams at JJ-CCR and Red Sea Explorers, who wanted to dive the key deep wrecks in the Egyptian part of the Red Sea, and at the same time look for new ones.

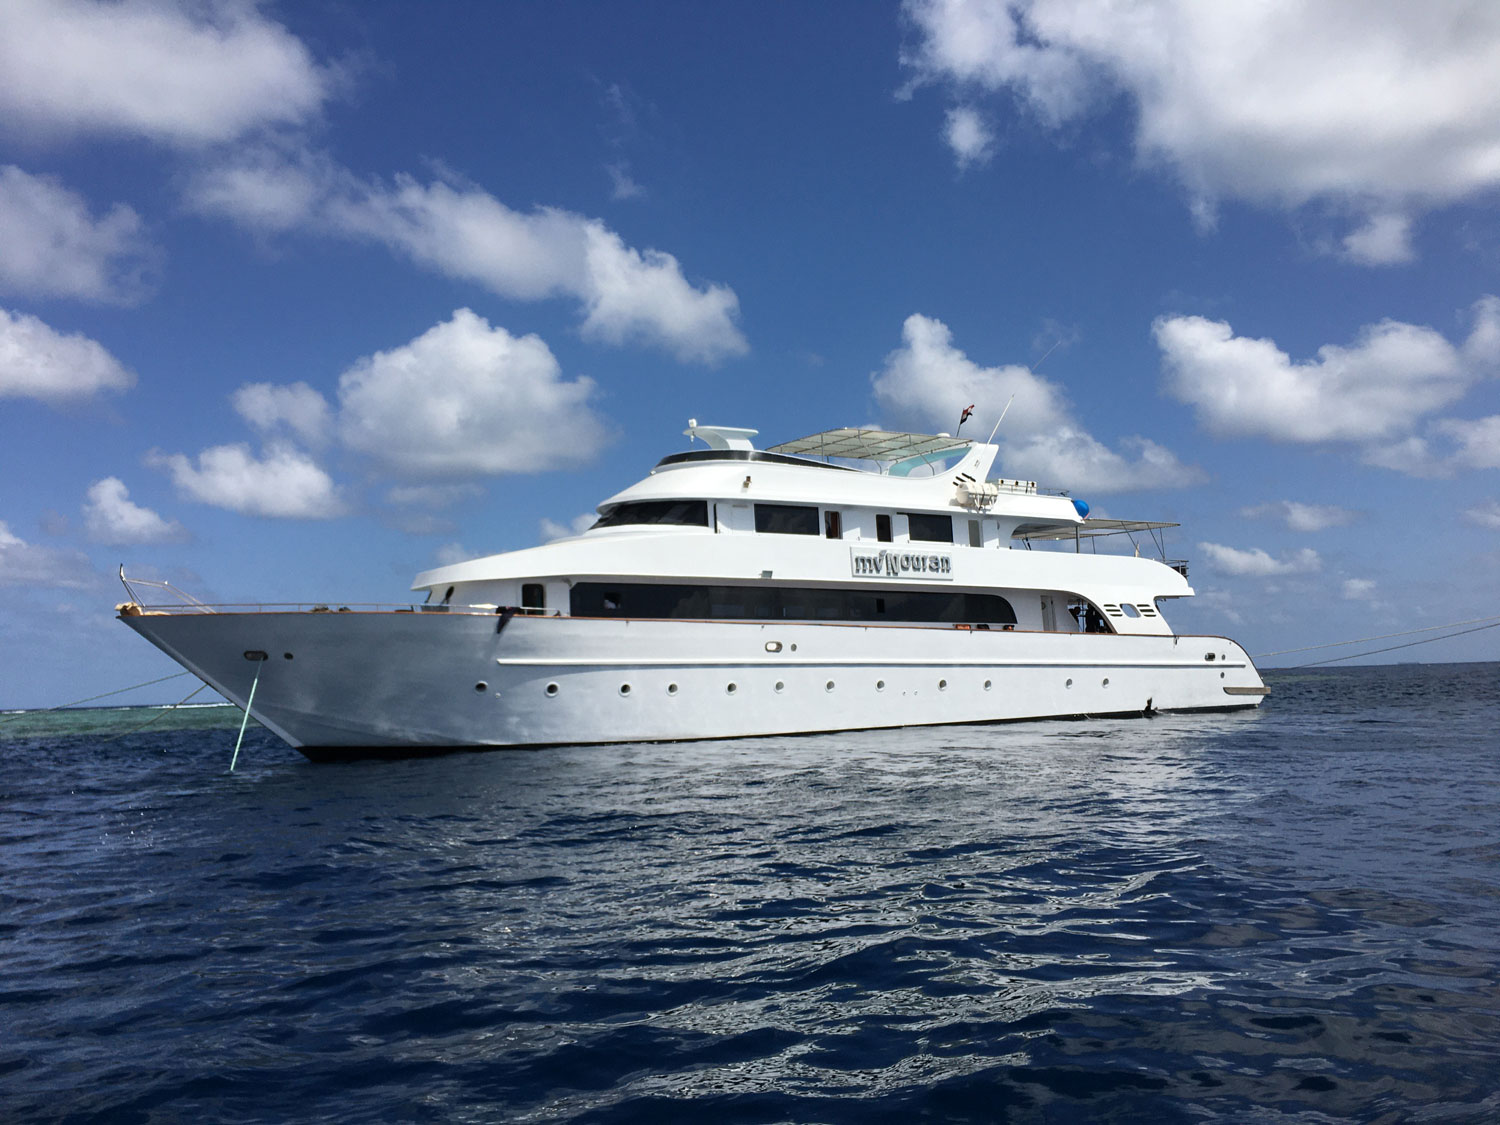
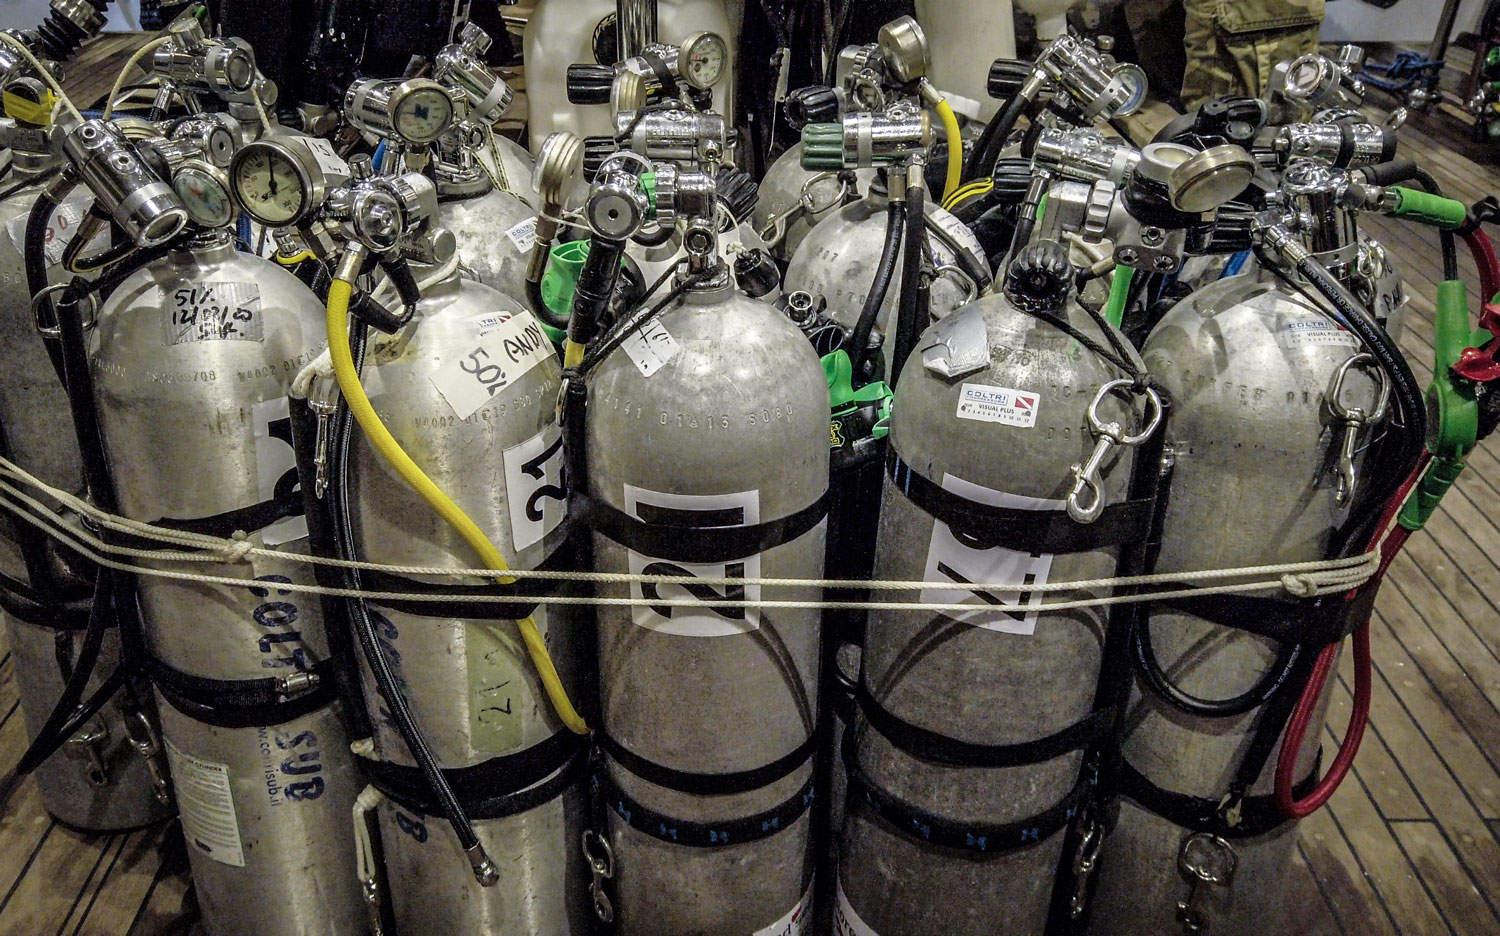
The dive plan was similar to that of the previous year, i.e. to make two deep trimix dives a day, unless the depth exceeded 100 m; in that case that would be the only dive of the day. The team planned to use scooters to extend their range, along with several different planned gas mixes (see table as an example). The expedition was planned for Mid-March aboard Red Sea Explorers liveaboard motor vessel MV Nouran. (see picture below). Due to the spread of the COVID-19 virus, which became alarming during the trip, our videographer Olga Martinelli, dubbed the voyage, the APOCALIPTRIP, and the name stuck.
A Bit of Scientific Background
Open-circuit scuba and closed-circuit rebreather (CCR) diving exposes the diver to a certain risk of decompression pathology, we now call Decompression Illness (DCI).
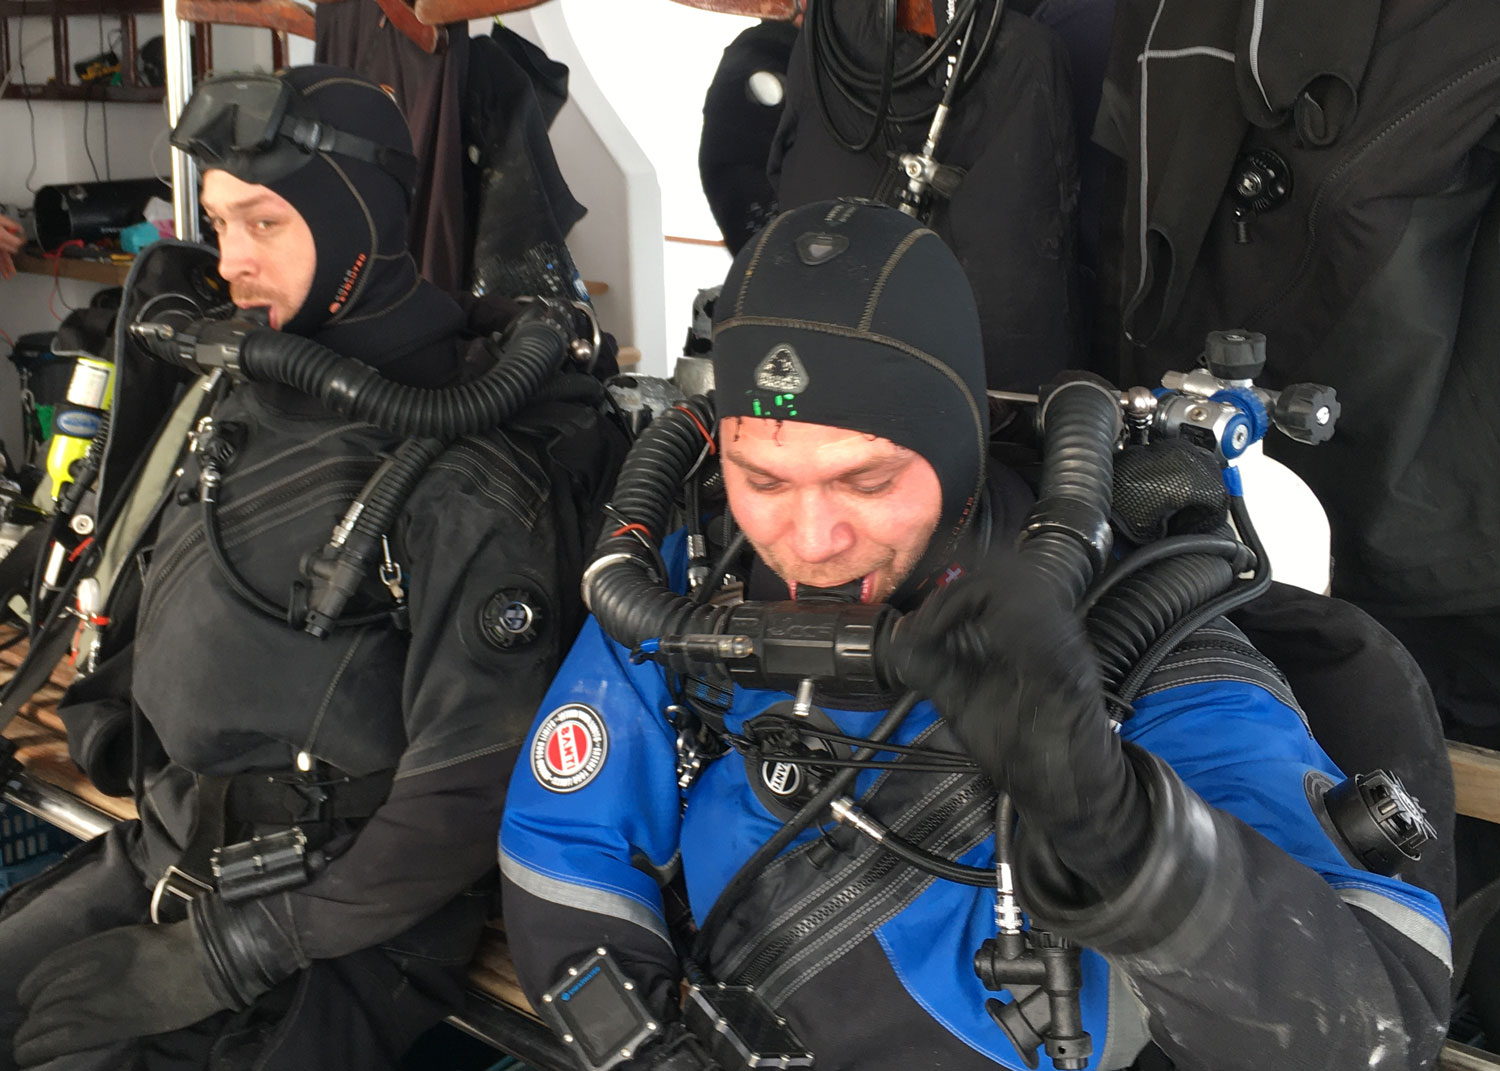
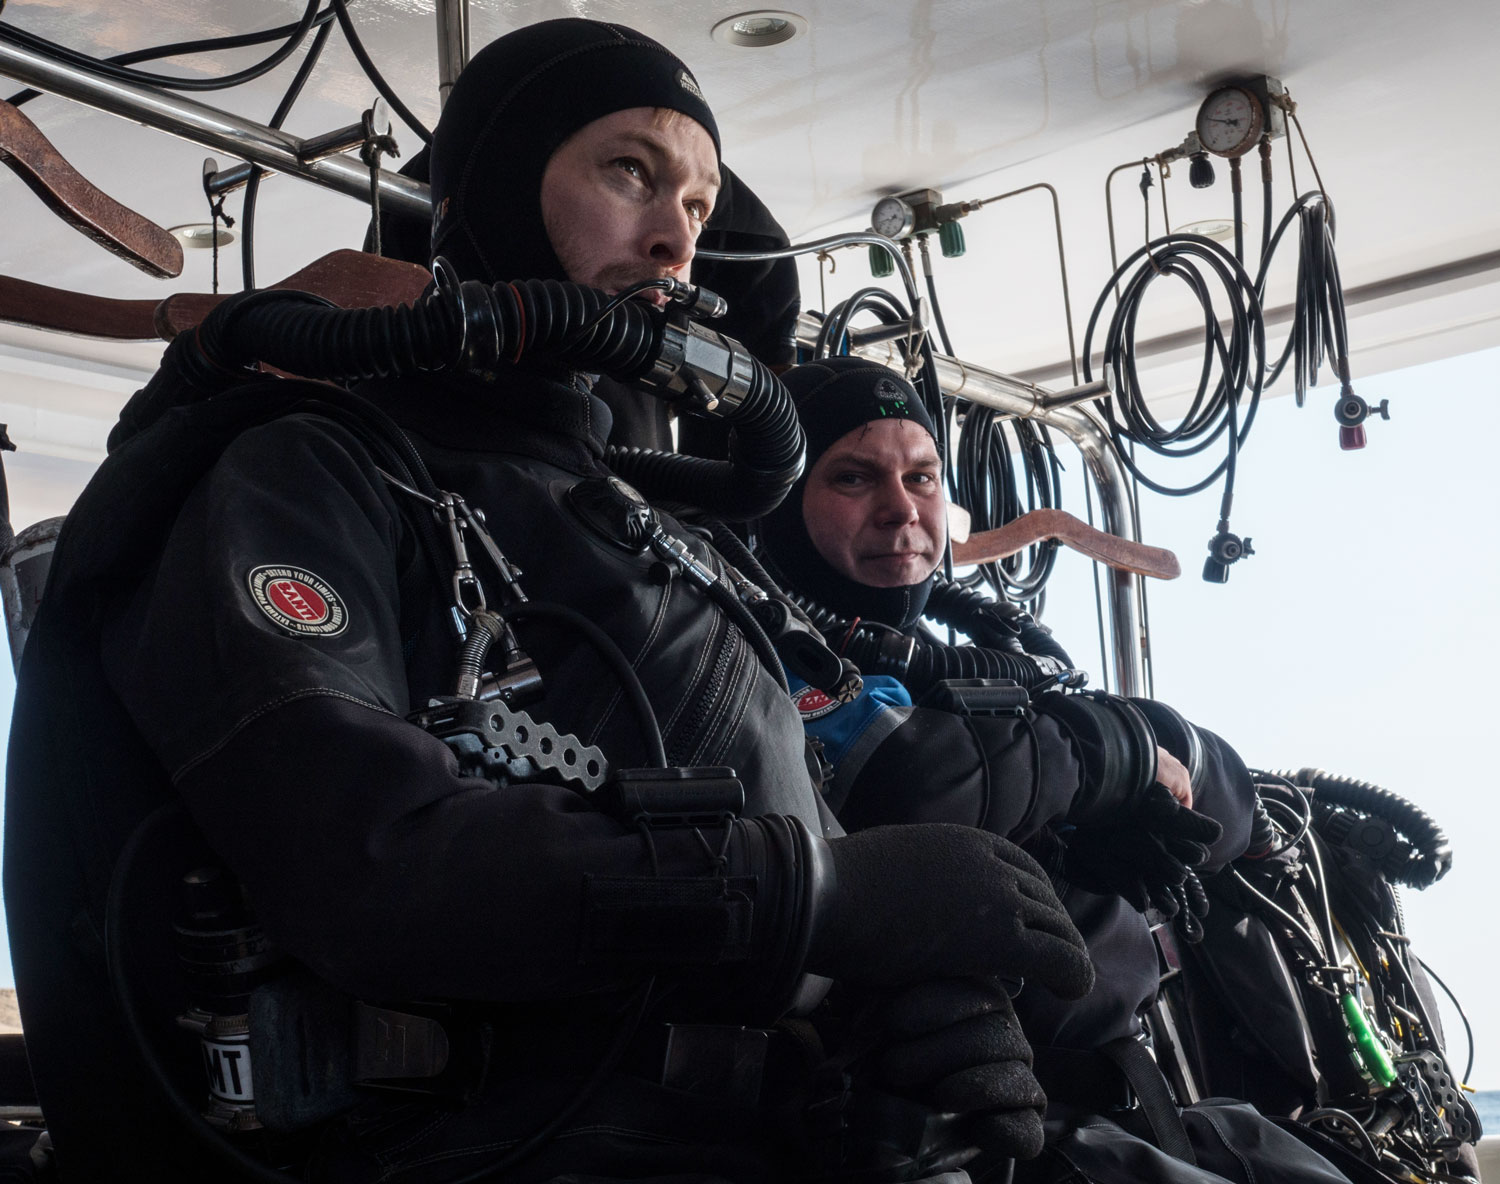
Divers performing their rebreather pre-breathe before making their dive.
Whereas some forms of DCI are related to pulmonary barotrauma (with clear symptoms), the least predictable diving pathology is (at least in part) caused by the presence of inert gas bubbles in tissue or blood vessels, which are formed during decompression and may cause decompression sickness (DCS).
Regardless of the decompression algorithm used, detectable vascular gas emboli (VGE) may be measured after recreational, technical and (to a lesser degree) professional diving; the quantity of VGE is considered to be statistically related to the risk of DCS after a dive.
Even though in diving medicine research, VGE grades are considered an imperfect “research endpoint” (as the ideal endpoint would be DCS, but for obvious ethical reasons this is unachievable), it is at present accepted that large-scale research projects on decompression safety can use VGE (Vascular Gas Emboli) data as a measuring endpoint.
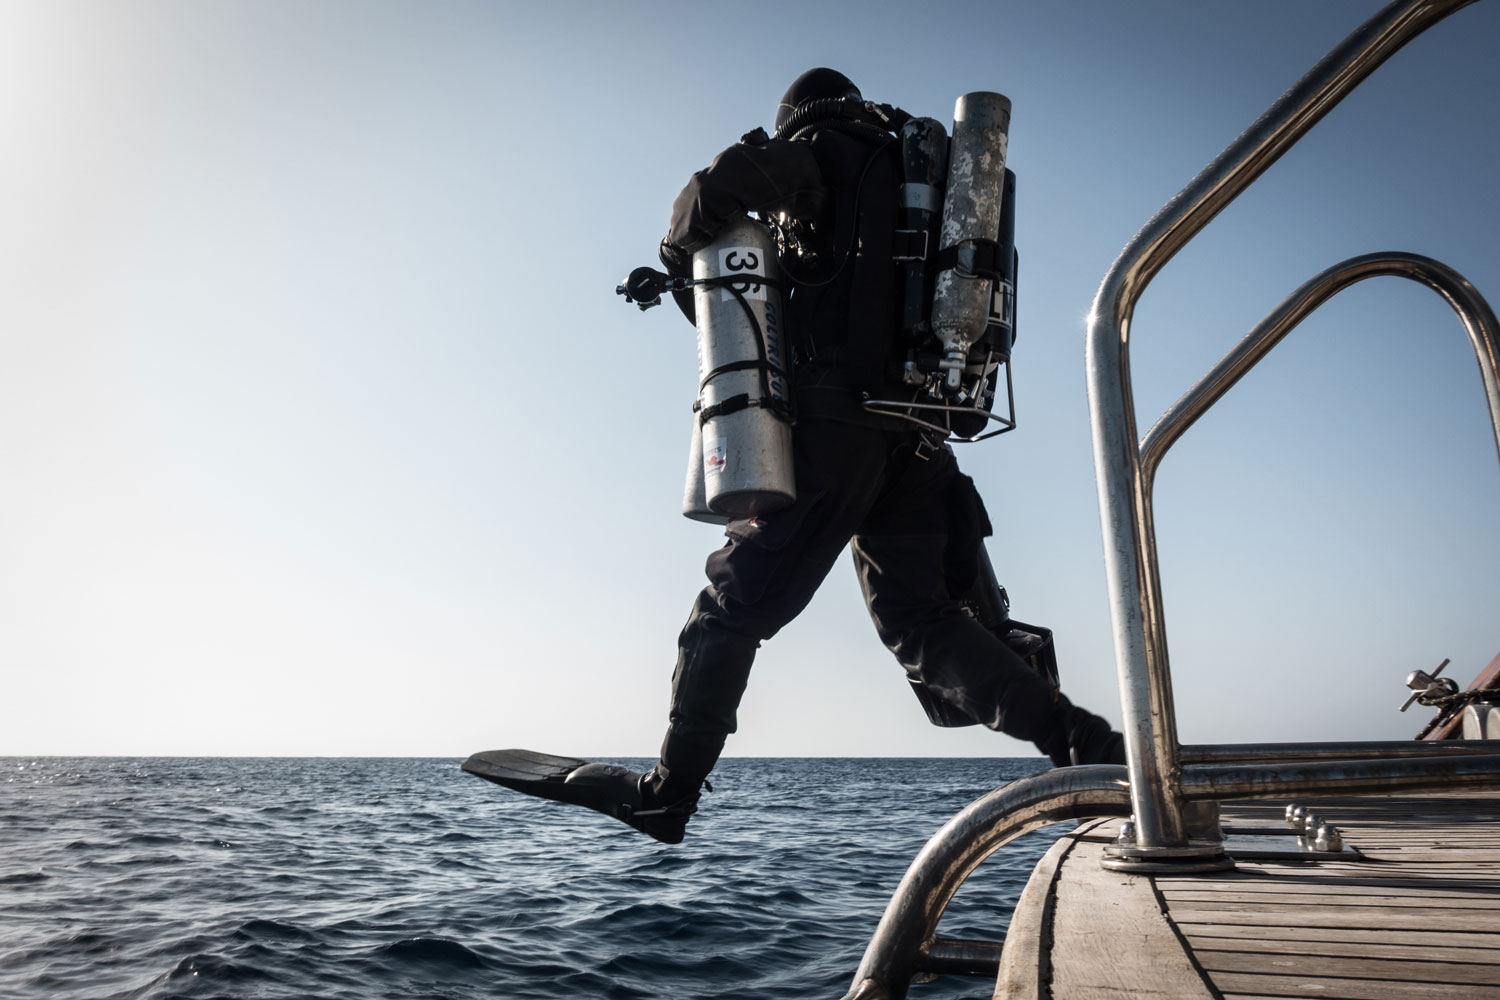
Very seldom articles are available in the medical literature on CCR diving. Recently something was published on the oxidative stress caused by high PO2 diving, but not much is known on the vascular gas emboli produced. We wanted to add knowledge on the bubble detection side using such diving procedures.
VGE can be detected through different methods. During field studies, bubbles are typically detected in the right atrium, ventricle and pulmonary artery acoustically using Doppler, or visually using 2D cardiac ultrasound. Various grading systems have been proposed, categorical or semi-quantitatively, and continuous.
Recently, the detection of VGE in subclavian veins has been proposed and validated, and a simple, do-it-yourself tool has been developed and is currently marketed. This tool, the Azoth Systems’ O’Dive sensor and app guides the diver through a series of self-measurements. After uploading the audio signals and related dive data to the Azoth Systems server, a proprietary algorithm is used to estimate the “quality of decompression” (inversely related to “risk for DCS”) for that dive.
The algorithm is based on existing dive data (amongst others French Navy and Canadian DRDC databases), but apparently also builds on contributed O’Dive app data to continuously adjust and optimize the evaluation.
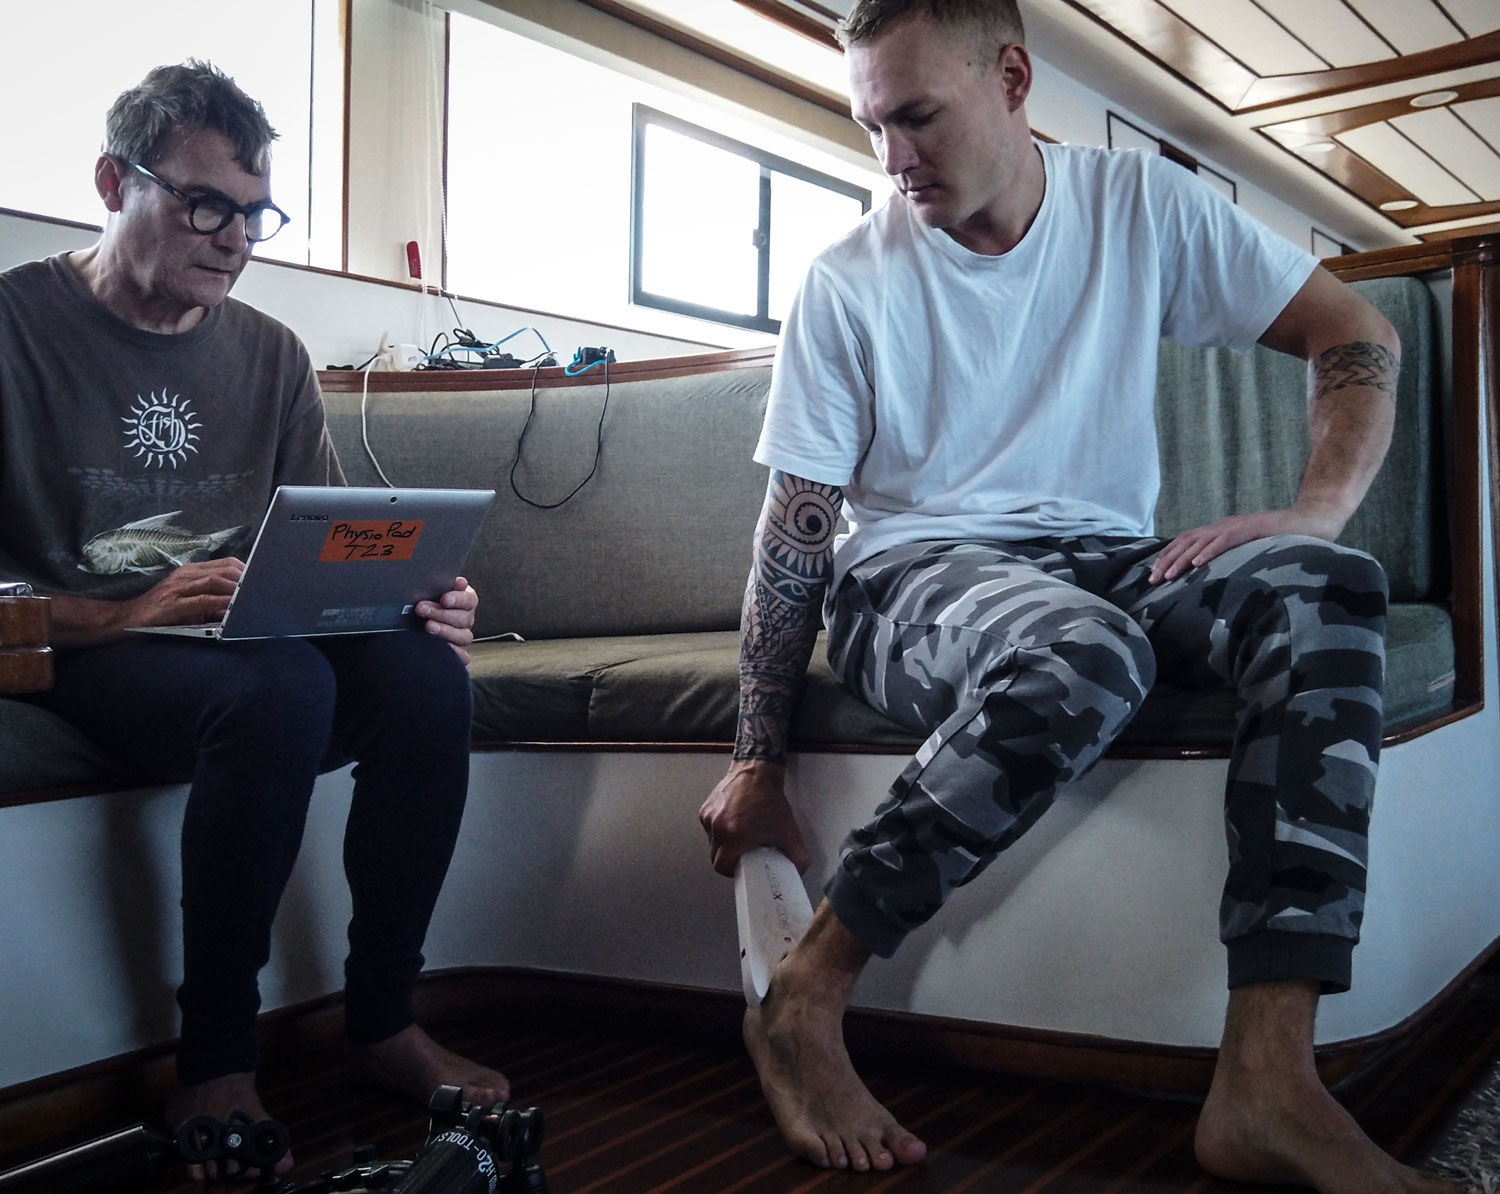
For this trip, we decided to add some additional parameters to monitor diver’s hydration: intracellular and extracellular water, and “total body water” estimated by means of multifrequency tetrapolar impedancemetry using the eBiody Xpert Body Analysis Solution.
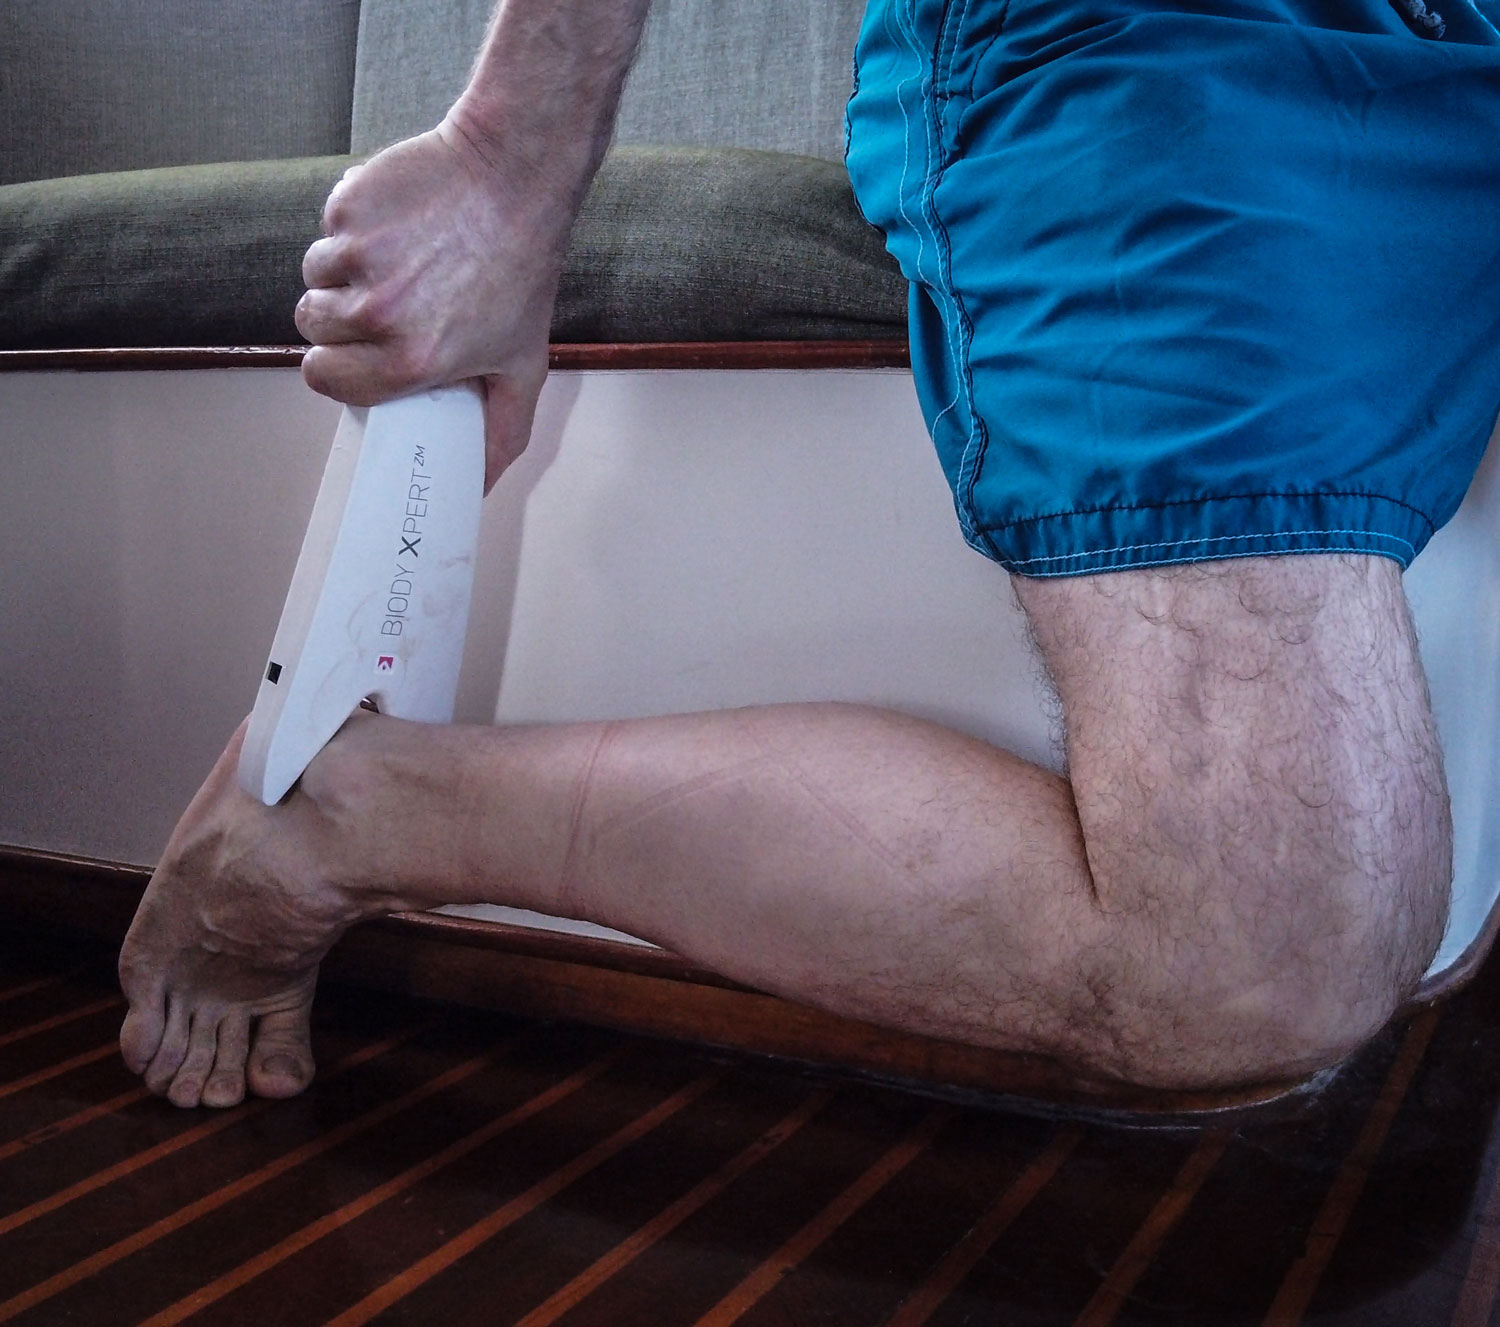
Bioimpedencemetry measurement.
The measurement was taken with a handy, easy-to-use Xpert tool already validated in the field of nutrition. The device is placed below the bi-malleolar space on each side of the ankle, and the thumb together with the right-hand fingers form the needed tetrapolar contacts. Five different low current frequencies are measured allowing numerous calculations. https://www.ebiody.com
In addition, each diver was weighted before and after dive, and a tetrapolar multifrequency impedencemetry was taken to precisely monitor his or her water distribution following decompression.
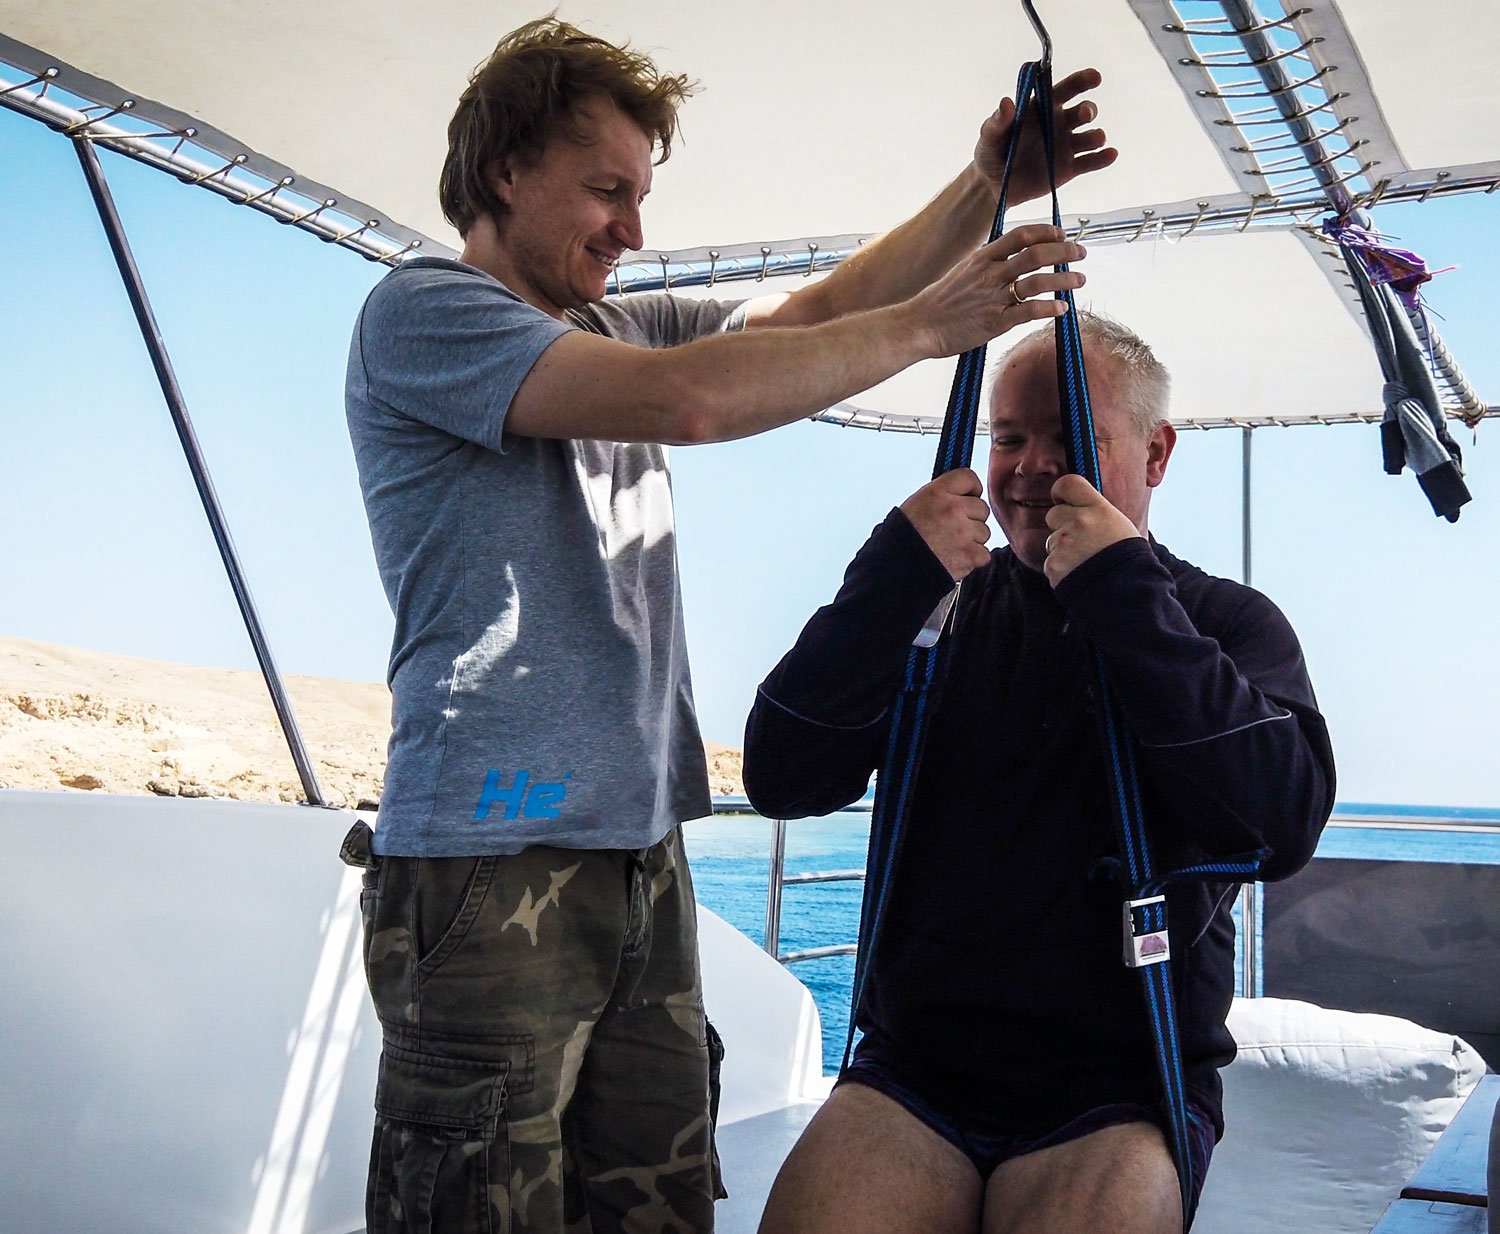
Divers weighting themselves.
Tiny Bubbles: Echocardiography
We used a portable SonoSite M-Turbo echocardiograph machine to record divers’ post-dive bubbles. Two measurements were taken post-dive at 30 and 60 minutes, and graded for further analysis.
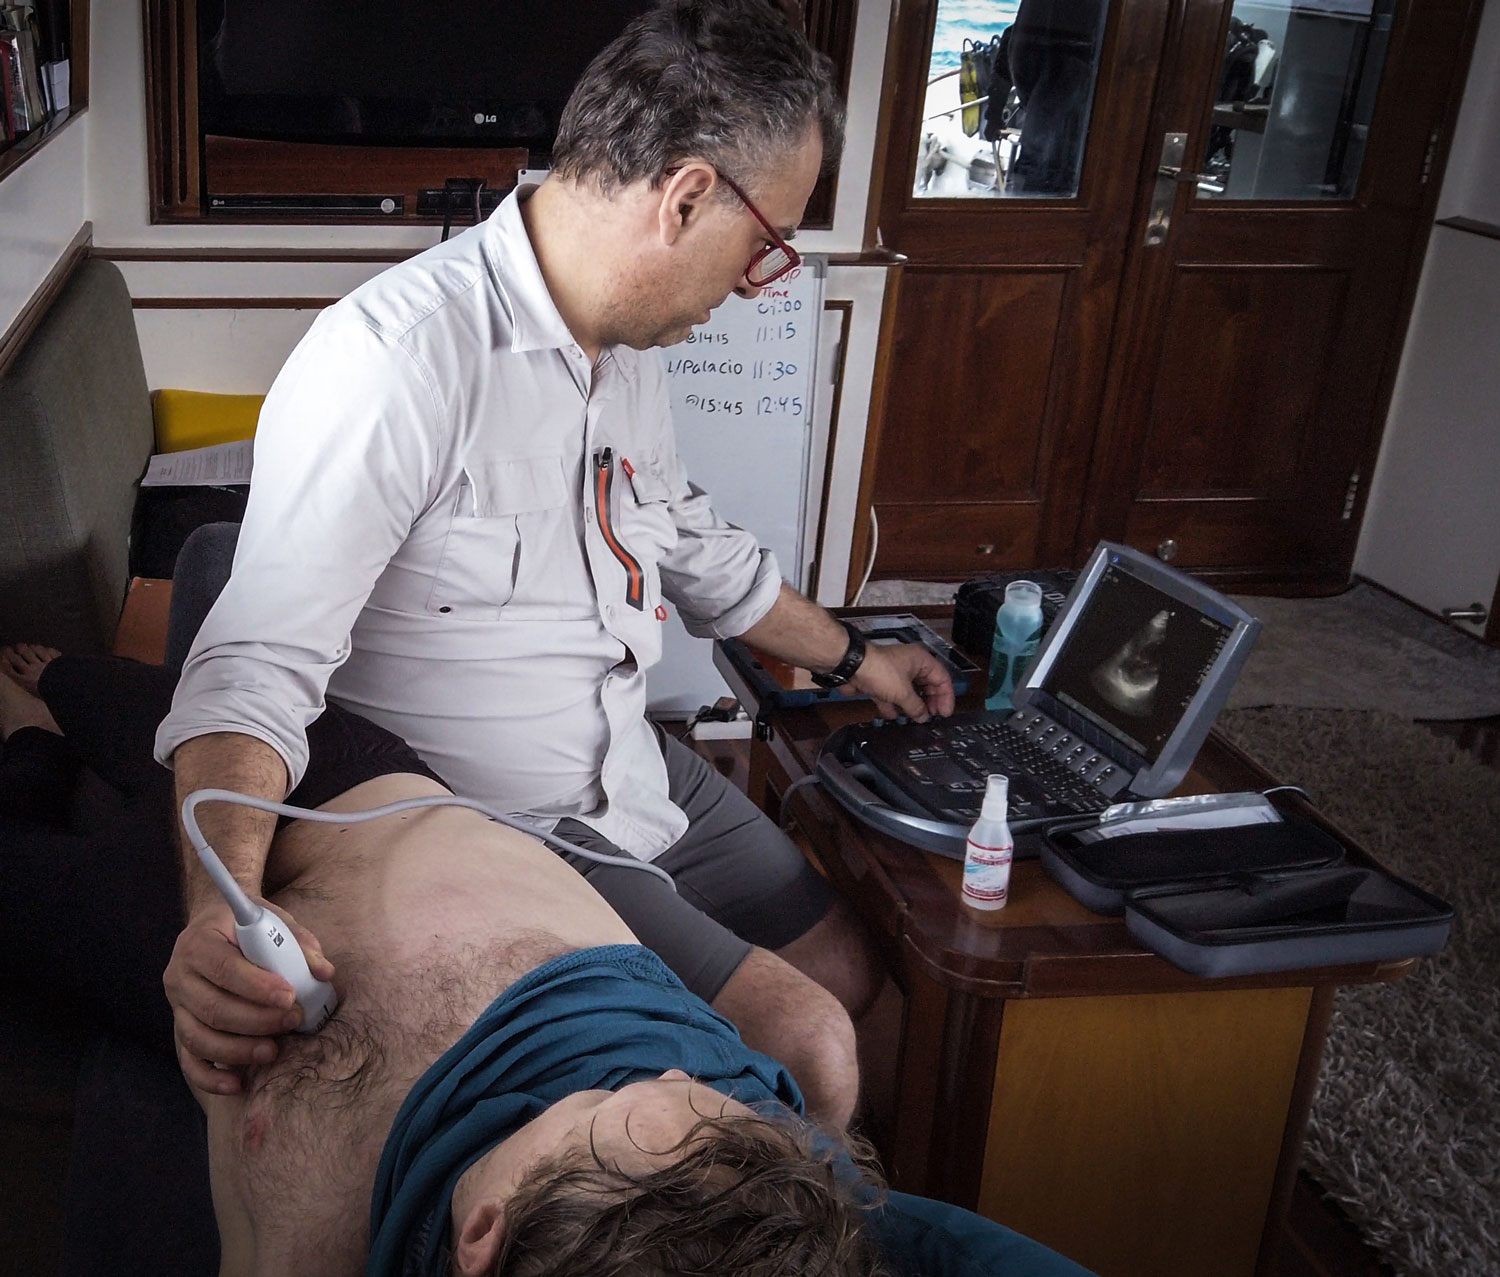
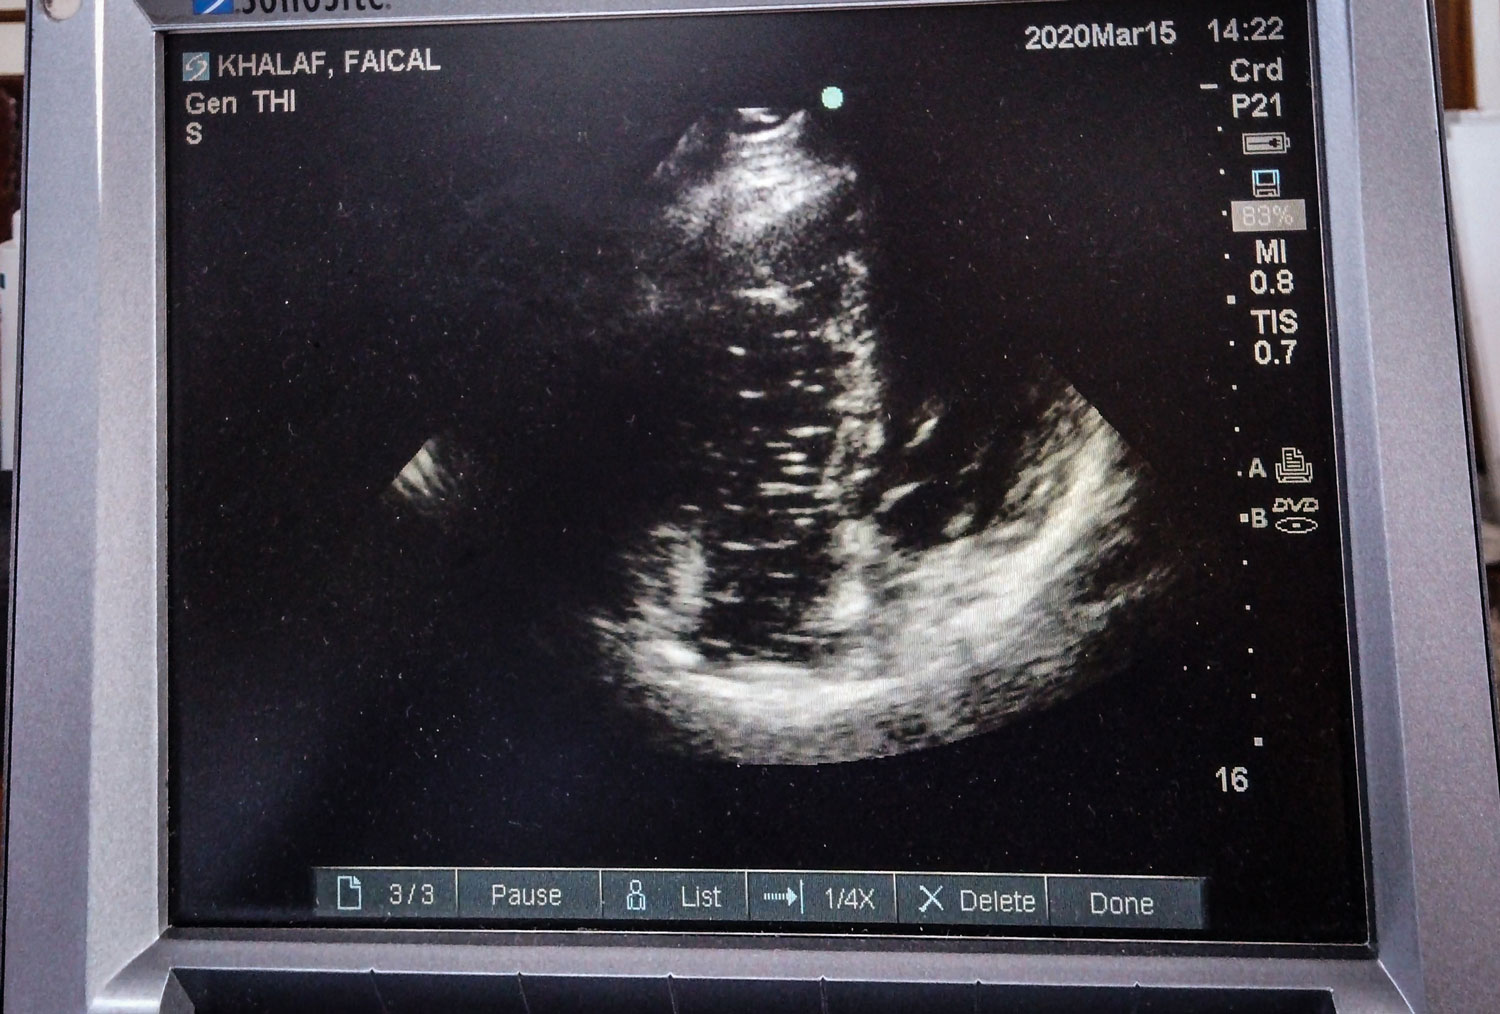
Echocardiographic bubbles measurements.
The echocardiography was evaluated by means of scoring according to a simplified bubble grading system was used for our statistical evaluation, as follows:
- Zero: No Bubble signal
- LBG Low Bubble Grade : occasional bubble signals, lower than 2 in the ESS
- HBG High Bubble Grade: Frequent to continuous bubble signals, 2 and 2.5 in the ESS
- HBG+ High Bubble Grade plus: Bubble signals reaching grade 3, 3.5, and 4 in the ESS.
ESS scale (See Marroni et al., 2004) reads as follow:
- Grade 0 : No Bubble Signals
- Grade 0.5 : 1–2 sporadic Bubble signals
- Grade 1 : Up to 5 Bubble signals
- Grade 1.5 : Up to 15 Bubble signals
- Grade 2 : Up to 30 Bubble signals
- Grade 2.5 : More than 30 Bubble signals
- Grade 3 : Virtually continuous Bubble signals
- Grade 3.5 : Continuous Bubble signals, with numerous bubble showers
- Grade 4 : Continuous
Tiny Bubbles: Subclavian Vein Measurements
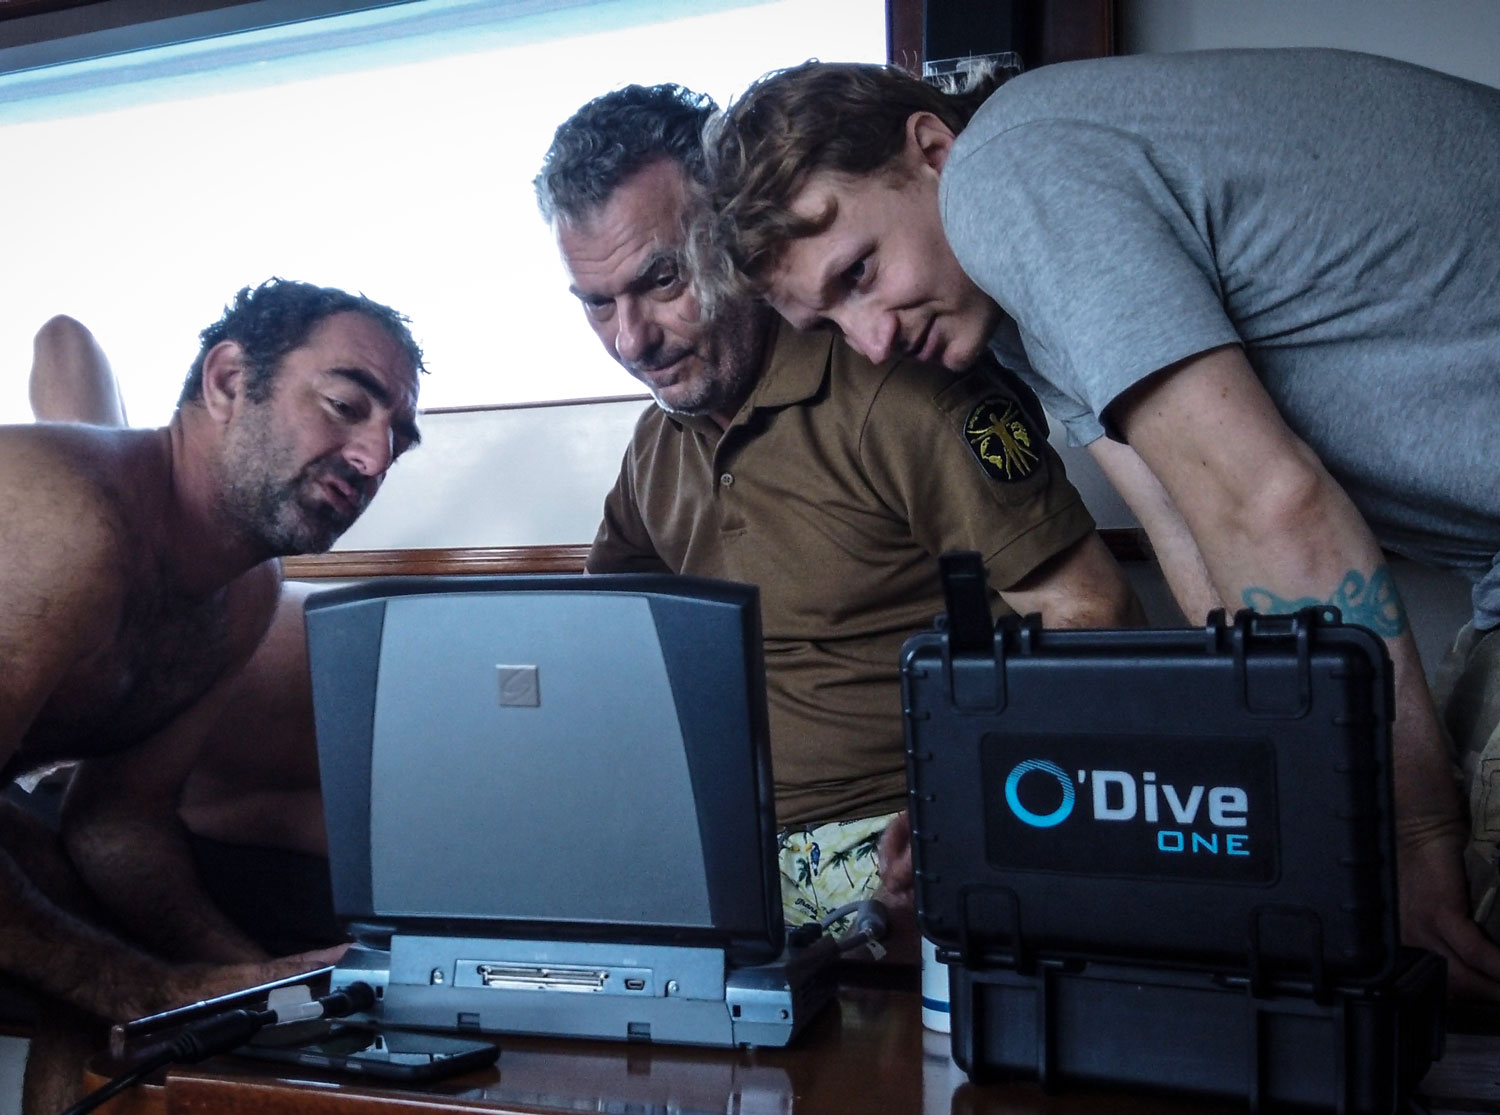
In addition to echocardiography, we also conducted subclavian vein measurements using Azoth-Systems O’Dive App which works with a connected ultrasonic sensor for bubbles detection that is linked to an iOS or Android phone or tablet by wireless connection.
The sensor is simple and robust and it was used to analyse individual bubble grades in the subclavian vein.
Again two measurements were taken, in this case, directly after each dive and 30 minutes post-dive. We used the “Tek” version of the O’Dive app, which enables one to enter various gas mixes (bottom gas, deco gas) into the data, select open or closed-circuit diving, provide Gradient Factors, as well as allowing a link with some brands of dive computer to upload the actual dive profile. For this project, Azoth Systems was kind enough to lend us the last unit dedicated to research called “O’Dive Vision,” which enabled us to access all of the raw data.
Analysis of the Doppler data is performed at the Azoth server side, according to an (undisclosed) analysis protocol. For research purposes, the bubble grade data (using an Azoth Systems protocol) was provided to us on a standard scale. Normally in the O’Dive app, the results are presented as bar graphs, indicating the “quality of decompression” using their Quality Index (QI) ranging from 0 to 100. The app shows three color codes going from green for good quality (QI from 100 to 75), to orange for a procedure of insufficient quality (QI below 50).
A dive’s QI is reduced by two factors: a Dive Severity Component (Cs) taking into the account the conservatism level of actual dive profile, and a Vascular Bubbles Component (Cb) computed from bubble counts, according to the formula QI = 100 – Cs – Cb. (See picture 9 on the right). For more information on O’Dive’s QI calculation see section four in “How Does The O’dive Application Operate?”
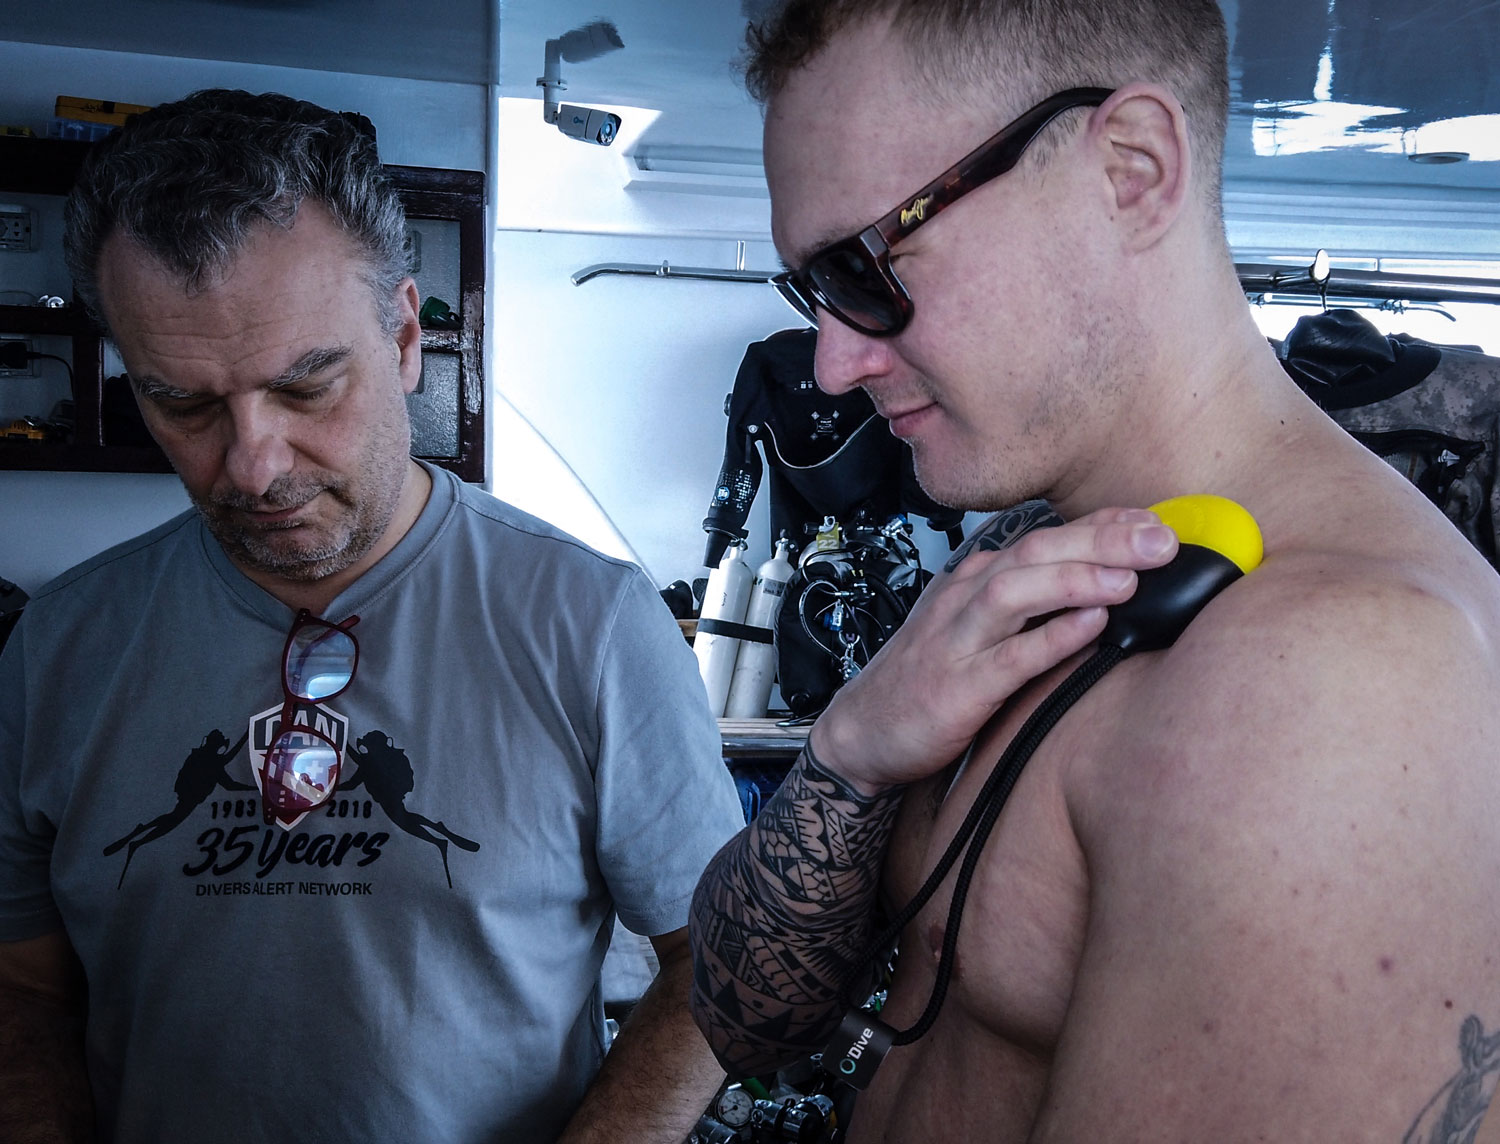
A diver taking his measurement of subclavian signals.
Participants, planned dives and goals
Ten experienced and enthusiastic divers participated and kindly agreed to be monitored during the 10-day diving safari on the MV Nouran, organized with JJ-CCR and the exceptional support of the Red Sea Explorer team!

Apart from DAN’s research, Faisal Khalaf, founder of Red Sea Explorers, set two goals for the trip: conducting expedition dives on known deep wrecks, and making exploration dives on new wrecks as a part of Red Sea Explorers’ Wreck Exploration Project. The difference, as Khalaf explained is that expedition dives are on known deep wrecks that require expedition setup and support as well as divers skilled enough go on these wrecks safely, whereas the exploration dives were made on locations where undiscovered wrecks were suspected to be.
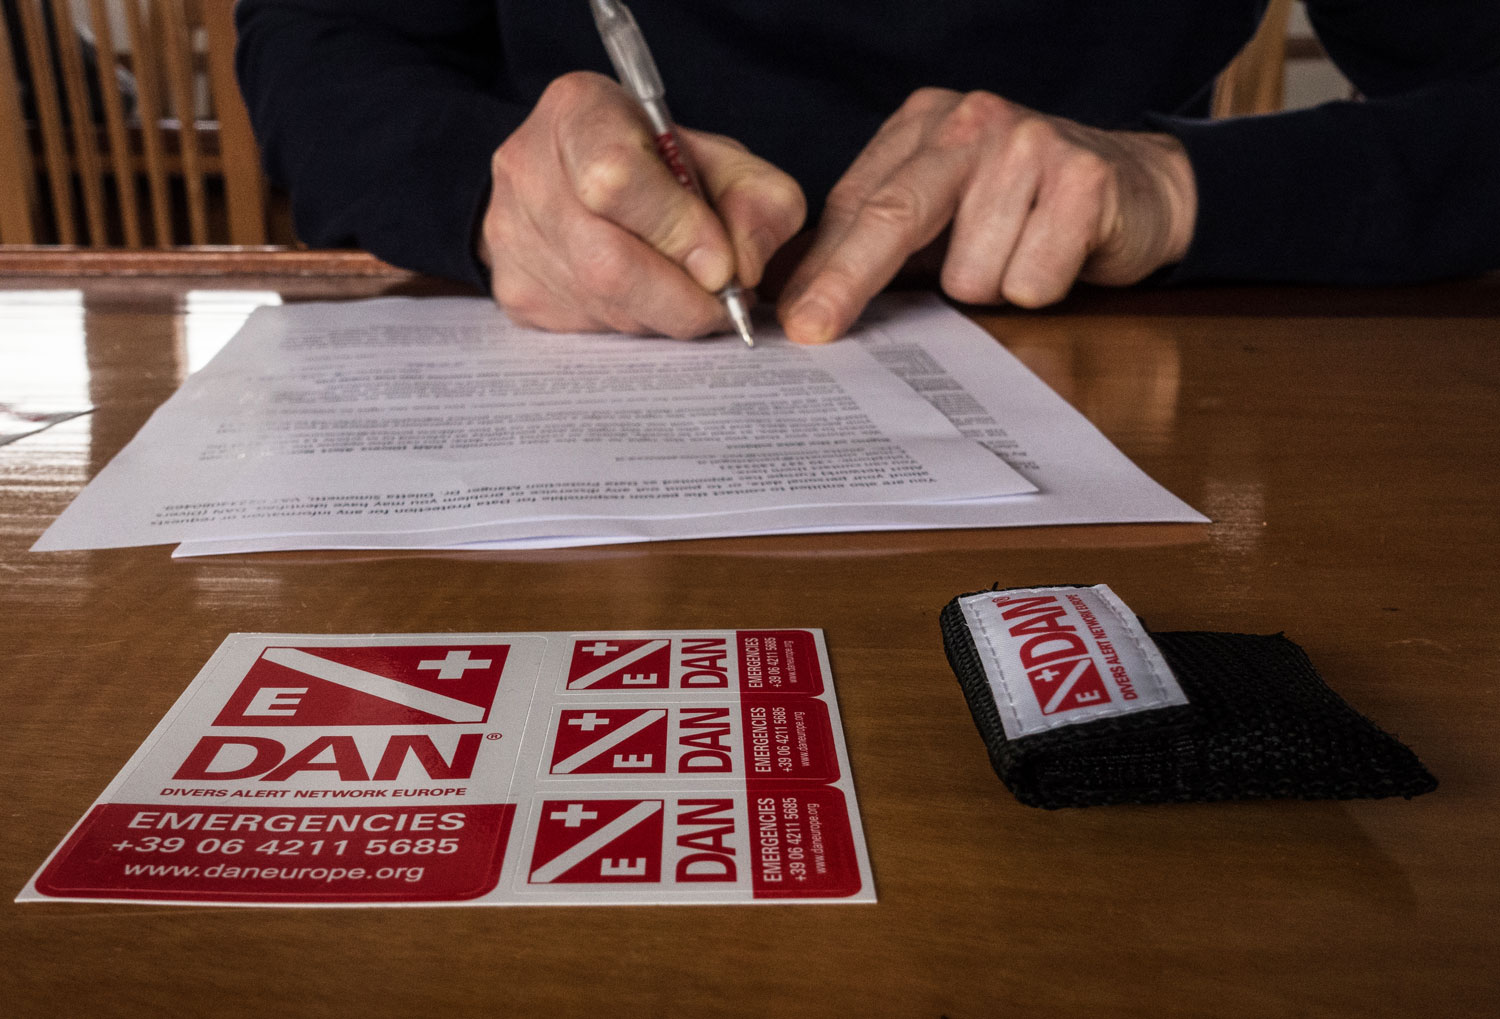
Paper work is still needed sometimes even during digital era!
Red Sea Explorers has amassed a number of these GPS locations by the old trusty method of working with fishermen in mutually beneficial manner. So far, the Wreck Exploration Project has produced six new wrecks in the Northern Red Sea including an English Collier from 1880, the Fulica, and the Almirante Barosso, a Brazilian Cruiser. Several new wrecks were dived during the research trip.
Exploring The S.S. Zealot
The S.S. Zealot found near the Daedalus Reef was a good example. The dive itself had two goals, first to explore the wreck and then search further out and deeper on the western plateau of the reef for the wreck of the S.S. Dacca.
The Zealot was a “spar decked double skinned iron hull screw steamship” of 1,328 Gross Registered Tonnage (GRT), she was launched on 30 January, 1873. She struck Daedalus reef in the autumn of 1876 on her way to Bombay with a cargo of iron. The bow is now located at 75m of depth with the stern lying further down the steep slope of the reef at 110 m. Two anchors are also located beside the ship at 88 m. This is definitely a dive only for the experienced technical diver.
The team planned to drop directly over the wreck, managing the current with the help of scooters and DPVs, and arrive at the shallow area of the wreck at 75 m where the bow and anchors are located. From there the divers continued to explore the wreck dropping down to the cargo holds and propeller area at around 105 m. As planned, 15 minutes into the dive, the group split into two teams in search of another wreck, the Dacca.
The S.S. Dacca was a steel screw steam-powered passenger cargo ship of 3,909 Gross Registered Tons (GRT). The ship struck the Daedalus Shoal at 06:30 am 16 May, 1890 on her way to Australia carrying cargo and passengers including 250 young single women bound for Australia as domestic servants.
Both teams dropped down as deep as 125 m, one heading south and the other north and around Daedalus Reef. It was approximately 40 minutes into the dive when the divers arrived at 80 m and began their assent scootering back to the Nouran, where they arrived after the planned 150 minutes of decompression.
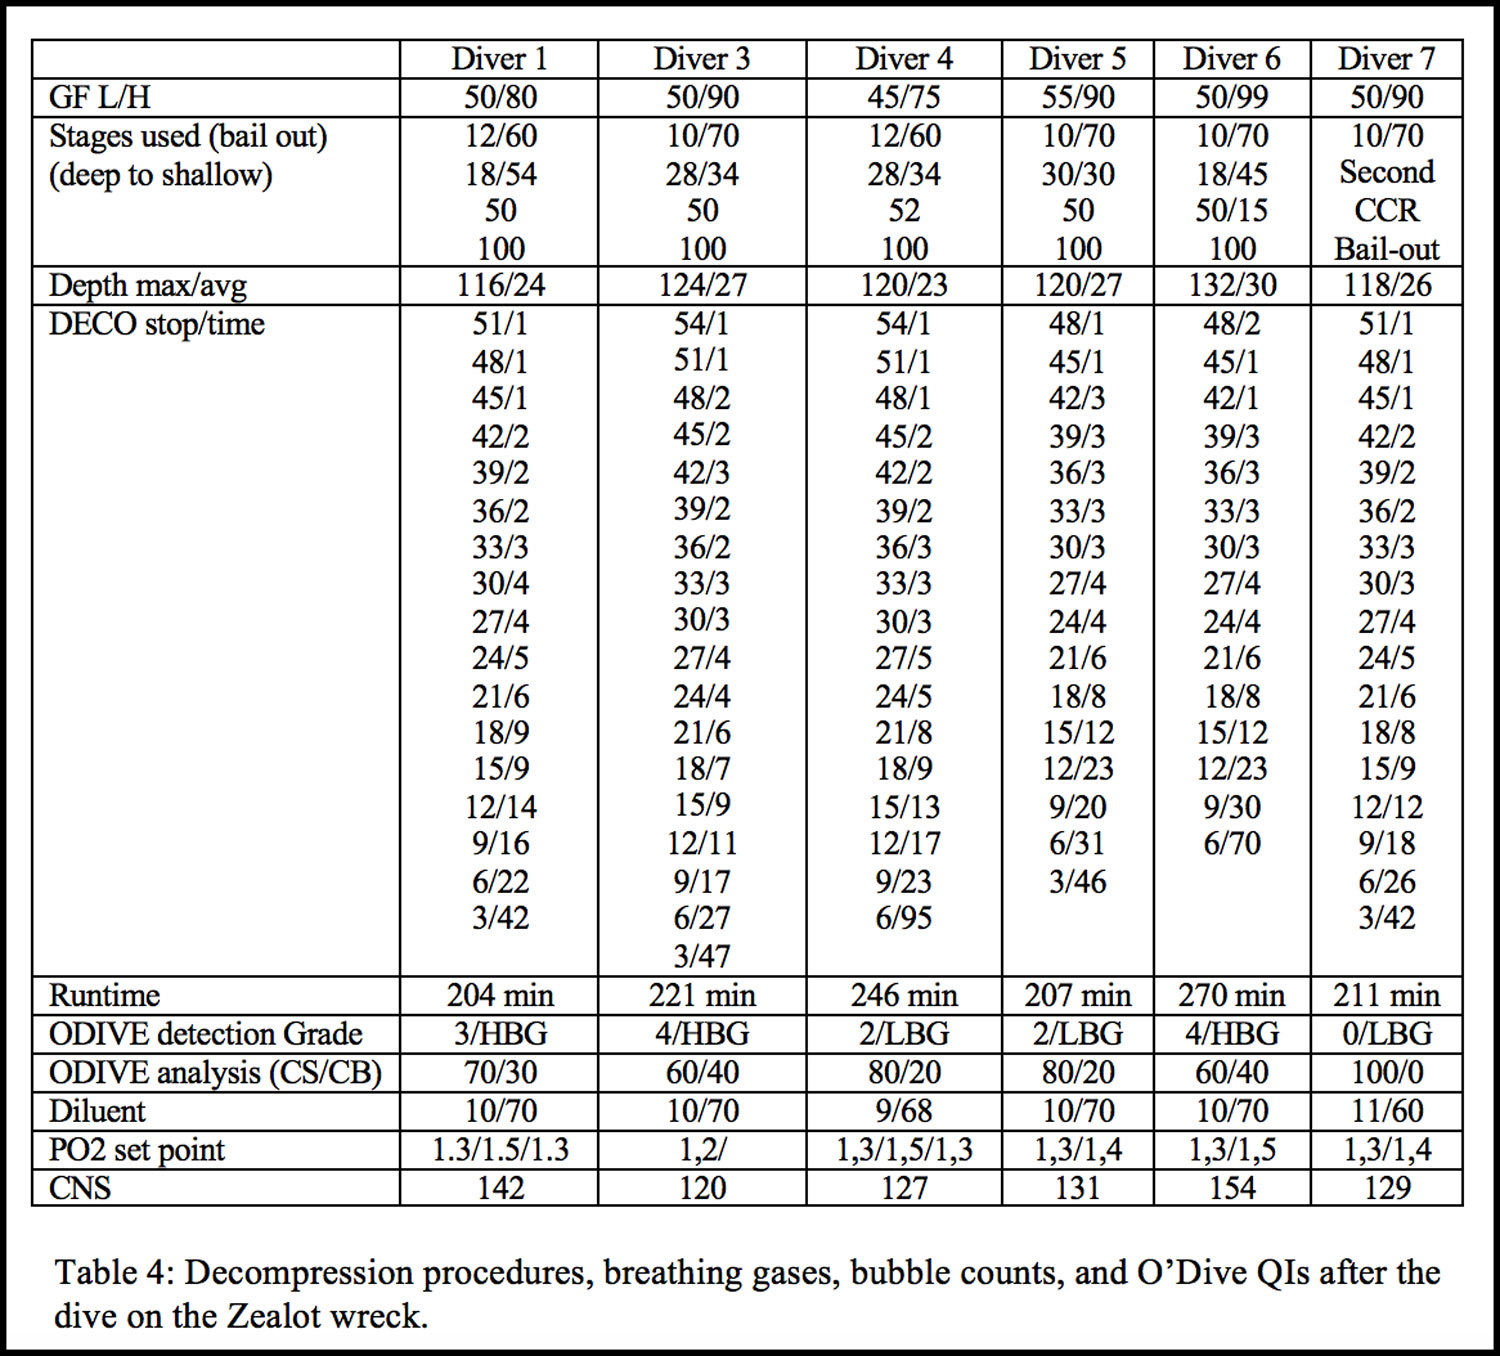
Considering that only half of bubble measurements were conducted at the same time (30-min post dive) a good concordance of bubble grades were observed between O’Dive technology and the echograph.
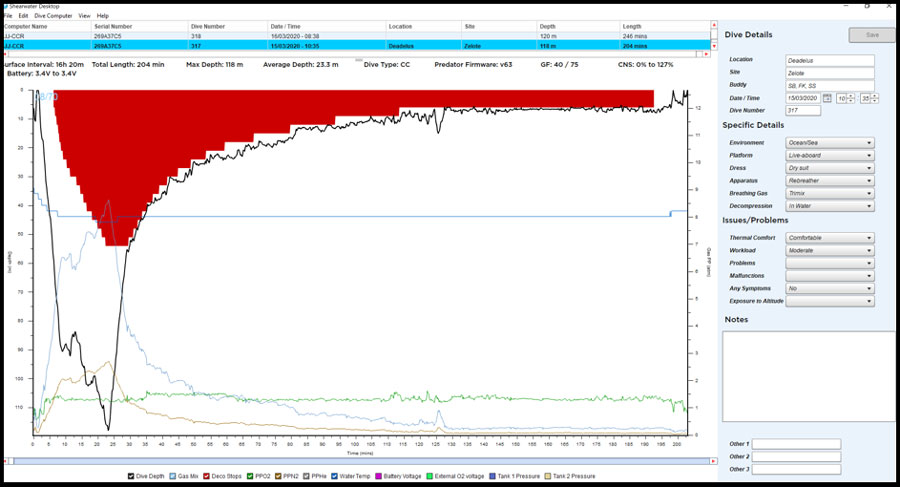
Graph 1: A screenshot of the dive profile for Diver 4 during the S.S. Zealot dives.
It’s All About The Data
Unfortunately, divers were not able to complete all the planned dives due to the evolving Covid-19 situation, and the fact that adequate onshore medical support was not available in the event of diving related problem. As a result, the decision was made to stop diving according to DAN Europe instructions, which are in line with the European Committee for Hyperbaric Medicine (ECHM) and the Société Belge de Médecine Hyperbare et Subaquatique (SBMHS) guidelines.
Fortunately, we were able to gather sufficient data to offer some insights and reflections.
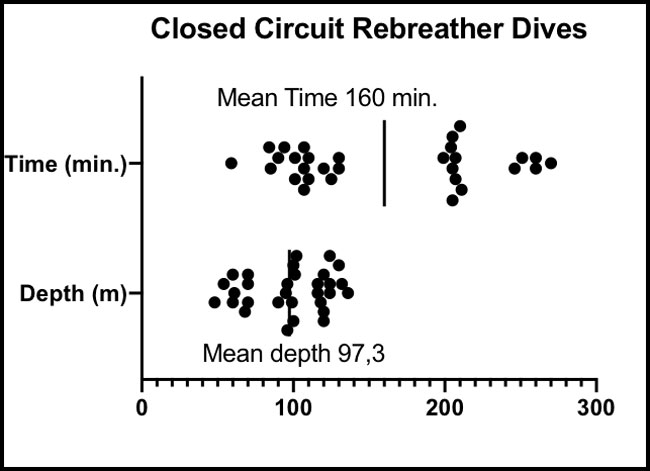
Figure 1: Mean and Standard Deviation of depth and Dive time n=30.
The mean depth for the dive series was around 100 m (97,3) with a mean run time of 160 minutes. Table 4 and the accompanying graph, show divers various decompression procedures. It appears that the deepest divers were using similar decompression schemes.
Bubble Count Changes After 100m Dives
As already seen divers have different bubbling patterns (Papadopoulou et al., 2018; Balestra et al., 2019; Imbert et al., 2019). These three 100 m dives were performed on consecutive days, some heavy bubblers changed the bubbling pattern, while others continued to bubble heavily or slightly reduced the number of bubbles. It is interesting to see that the second dive, seems to produce fewer bubbles compared to the third, although statistical significance was not reached due to data variability. The bubbles on the second dive were reduced apart from a consistently heavy bubbler. This tendency was further visible in the following graph.
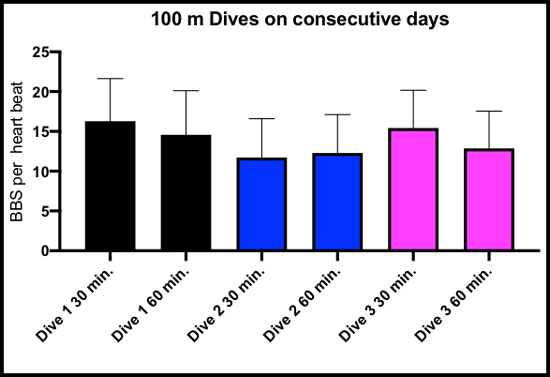
Figure 3: Mean and Standard error on mean (SEM) of the number of bubbles per heart beat at 30 and 60 post dive. BBS=Bubbles.
Overall the dive with fewer bubbles is the second one. As proposed very recently this might be the result of the time needed for new SMB (Static Metabolic Bubbles) to form. One explanation could be that the bubbling pattern from the first and the third dive was a mix of a certain population of SMB-derived decompression bubbles. The second pattern could have been from a different population, which might have been smaller sized and didn’t reach the critical volume during decompression of the second dive, but were ready to be released by the time of the third dive.
Getting and Staying Wet
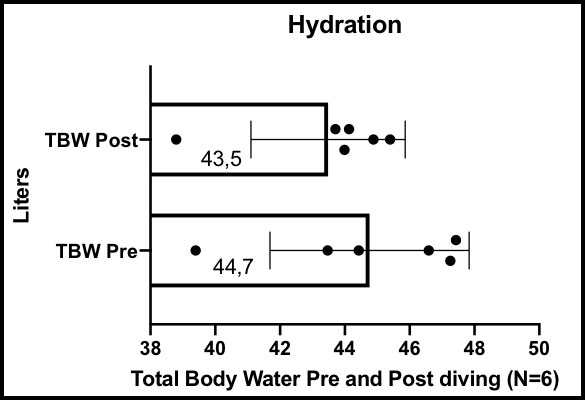
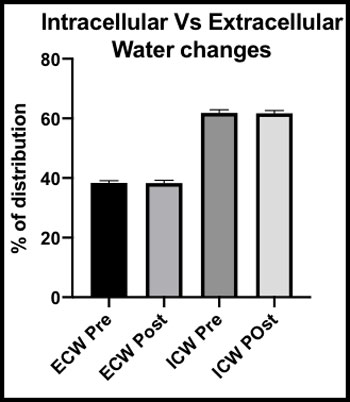
Figure 4 and 5: Total body water difference after diving, and on the right part no significant difference seen on water distribution (around 45 minutes after diving).
Divers’ hydration has long been considered as a critical point for decompression safety. We have also known for some years that plasmatic surface tension is very little changed by hydration but that plasmatic volume suffers drastic changes in the first minutes post dive, and even tissue hydration can vary after diving.
Our goal, during the research trip was to measure the hydration state of the divers.
As you can see, diving reduces total body water by about 1 liter of water. No variation is seen in intracellular and extracellular water take around 45-75 minutes post diving.
The changes of total body water after a shallower (30 min/30 m with a 9 min at 3 m stop) and shorter dive ranging from 800 ml to 1500 ml with a mean of 1,20l liters.
Overall divers seemed to be less dehydrated on what were considerable dives with a mean runtime of 160 minutes. It would seem that breathing moist gas from a (rebreather) loop helps.
Conclusions
Everyone got back home safely following the “APOCALIPTRIP” though by different means; some had to shorten the trip to catch the last plane available. An in-depth analysis of the data was sent to all of the trip participants. Technical divers have personality traits that make them attractive for study; they have a strong belief that it is possible to do things right, and they are not deterred by a DCS occurrence or even several DCS occurrences.
Our trip triggered some good reflexions and it will possibly be the starting point for further tech diving research. One diver summed up the project this way:
“This science is continuing to expand our understanding of the ever-evolving decompression strategies being put forth by the diving and the scientific communities. However, it has mainly solidified my belief that every diver has the responsibility to be honest about how they feel after diving and continue to add conservatism to their profiles until they feel their [decompression] stress levels are acceptable.”
As a final word to close the APOCALIPTRIP: NO REGRETS! (Original sentence! FYI-inside joke)
Thanks to all involved in the organisation and to the liveaboard staff!
Divers: Søren Bøwadt, Matijn Buwalda, Faisal Khalaf, Olga Martinelli, Andreas Bøwadt, Peter Germonpré, Costantino Balestra, Patrick Valkenborghs, Alan Kilcline, Christiaan Hedges, Jan Petersen, Thomas Solberg, Lars Martin Thorstein, Pavel Okishev, Steffen G .Scholtz.
Expedition partners: JJ-CCR, Red Sea Explorers and O’Dive by Azoth Systems.

What Some of The Divers Had To Say
REFERENCES:
Balestra C, Cimino F, Theunissen S, Snoeck T, Provyn S, Canali R, Bonina A & Virgili F. (2016a). A red orange extract modulates the vascular response to a recreational dive: a pilot study on the effect of anthocyanins on the physiological consequences of scuba diving. Nat Prod Res 30, 2101-2106.
Balestra C & Germonpre P. (2014). The Science of Diving. Lambert Academic Press, Saarbrücken, Germany.
Balestra C, Germonpre P, Rocco M, Biancofiore G & Kot J. (2019). Diving physiopathology: the end of certainties? Food for thought. Minerva anestesiologica 85, 1129-1137.
Balestra C, Theunissen S, Papadopoulou V, Le Mener C, Germonpre P, Guerrero F & Lafere P. (2016b). Pre-dive Whole-Body Vibration Better Reduces Decompression-Induced Vascular Gas Emboli than Oxygenation or a Combination of Both. Front Physiol 7, 586.
Bosco G, Rizzato A, Quartesan S, Camporesi E, Mrakic-Sposta S, Moretti S, Balestra C & Rubini A. (2018). Spirometry and oxidative stress after rebreather diving in warm water. Undersea Hyperb Med 45, 191-198.
Dunford RG, Vann RD, Gerth WA, Pieper CF, Huggins K, Wacholtz C & Bennett PB. (2002). The incidence of venous gas emboli in recreational diving. Undersea Hyperb Med 29, 247-259.
Eftedal O & Brubakk AO. (1997). Agreement between trained and untrained observers in grading intravascular bubble signals in ultrasonic images. Undersea Hyperb Med 24, 293-299.
Gempp E, Blatteau JE, Pontier JM, Balestra C & Louge P. (2009). Preventive effect of pre-dive hydration on bubble formation in divers. Br J Sports Med 43, 224-228.
Germonpre P, Papadopoulou V, Hemelryck W, Obeid G, Lafere P, Eckersley RJ, Tang MX & Balestra C. (2014). The use of portable 2D echocardiography and 'frame-based' bubble counting as a tool to evaluate diving decompression stress. Diving Hyperb Med 44, 5-13.
Hugon J, Metelkina A, Barbaud A, Nishi R, Bouak F, Blatteau JE & Gempp E. (2018). Reliability of venous gas embolism detection in the subclavian area for decompression stress assessment following scuba diving. Diving Hyperb Med 48, 132-140.
Imbert JP, Egi SM, Germonpre P & Balestra C. (2019). Static Metabolic Bubbles as Precursors of Vascular Gas Emboli During Divers' Decompression: A Hypothesis Explaining Bubbling Variability. Front Physiol10, 807.
Lafere P, Balestra C, Caers D & Germonpre P. (2017). Patent Foramen Ovale (PFO), Personality Traits, and Iterative Decompression Sickness. Retrospective Analysis of 209 Cases. Front Psychol 8, 1328.
Marroni A, Bennett PB, Cronje FJ, Cali-Corleo R, Germonpre P, Pieri M, Bonuccelli C & Balestra C. (2004). A deep stop during decompression from 82 fsw (25 m) significantly reduces bubbles and fast tissue gas tensions. Undersea Hyperb Med 31, 233-243
Mollerlokken A, Blogg SL, Doolette DJ, Nishi RY & Pollock NW. (2016). Consensus guidelines for the use of ultrasound for diving research. Diving Hyperb Med 46, 26-32.
Ozyigit T, Yavuz C, Egi SM, Pieri M, Balestra C & Marroni A. (2019). Clustering of recreational divers by their health conditions in a database of a citizen science project. Undersea Hyperb Med 46, 171-183.
Papadopoulou V, Germonpre P, Cosgrove D, Eckersley RJ, Dayton PA, Obeid G, Boutros A, Tang MX, Theunissen S & Balestra C. (2018). Variability in circulating gas emboli after a same scuba diving exposure. Eur J Appl Physiol 118,1255-1264.
Vann RD, Butler FK, Mitchell SJ & Moon RE. (2011). Decompression illness. Lancet 377, 153-164.


